

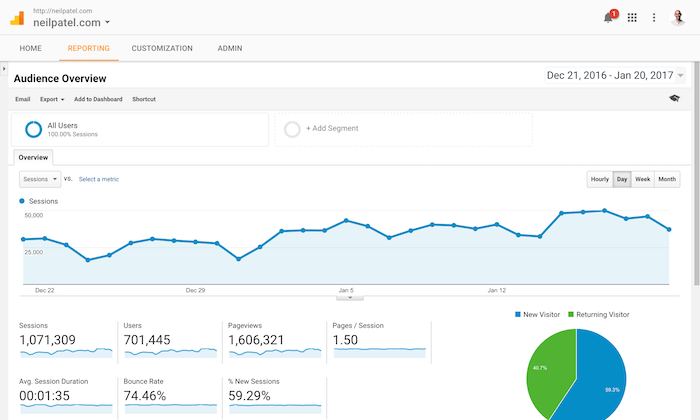
For marketers Google Analytics can provide a wealth of information about your website and audience. Sometimes it’s easy to get caught up in the day to day marketing activities and gloss-over warning signs.
We’ve highlighted 3 red flags you should be looking for in your Google Analytics data. We also reveal how you can combine it with dynamic heatmaps and visitor recordings to increase the number of leads from your website.
What to Look for in Google Analytics?
Low Time Spent on Page
Time on page: the average amount of time a user spends on that particular page on your website.
Time on site/session duration: how long a user spends on your site in total.
When is it a red flag?
The average time spent on the page is low and your exit rate is high. As a marketer, it’s for you to determine why this might be.
Typically, it’s because the content isn’t captivating, your site isn’t attracting the right target customer, or it doesn’t have the content they were looking for.
When is it not a red flag?
The average time on page is low but it’s still converting, for example a landing page for one of your CPDs.
High Bounce Rate
A bounce is a single page session on your site. Somebody came to your site through Google, social media, PPC etc. then left immediately. According to SEMRush, it’s the 4th most important ranking factor for search engines.
When is it a red flag?
Over 70% should cause for concern outside of news and blog pages.
The wrong audience: take a look at your Google Search Console data. Are the queries relevant to your business?
Frustrated visitors: poor load speeds, check your site renders well across multiple devices.
Top tip: view how your page looks on multiple devices from your desktop in Chrome.
right-click → inspect→ toggle device toolbar
Unhappy visitors: ensure you make a good first impression, an immediate pop-up will put visitors off whereas trust signals will have the opposite effect.
When is it not a red flag?
When your bounce rate is between 30-50%.
According to HubSpot research this is the benchmark for lead generation websites.
High bounce rate? News or blog pages will typically have a bounce rate of 70-98% as readers will have come for a specific story.
Poor Website Visitors to Leads Ratio
There might be a range of reasons why your website isn’t converting visitors into leads for your sales and marketing teams. Rather than get lost in the details, take a step back and ask yourself these questions:
- Is our website attracting the right audience?
- Does the copy on our website speak to the pain points of our buyer personas?
- Are there enough conversion opportunities on our site?
- Do they reflect the stages of our buyer’s journey?
Fixing Google Analytics Red Flags
As a marketer, it’s likely you’ve run into optimisation issues in the past and the usual fixes may not be working.
It’s time to get a deeper understanding of what your visitors are doing on your site.
- Dynamic heatmaps – visually represent the behaviour of users on your site
- Visitor recordings – watch recordings of what visitors are doing on your site
Using Dynamic Heatmaps to Identify Problem Areas
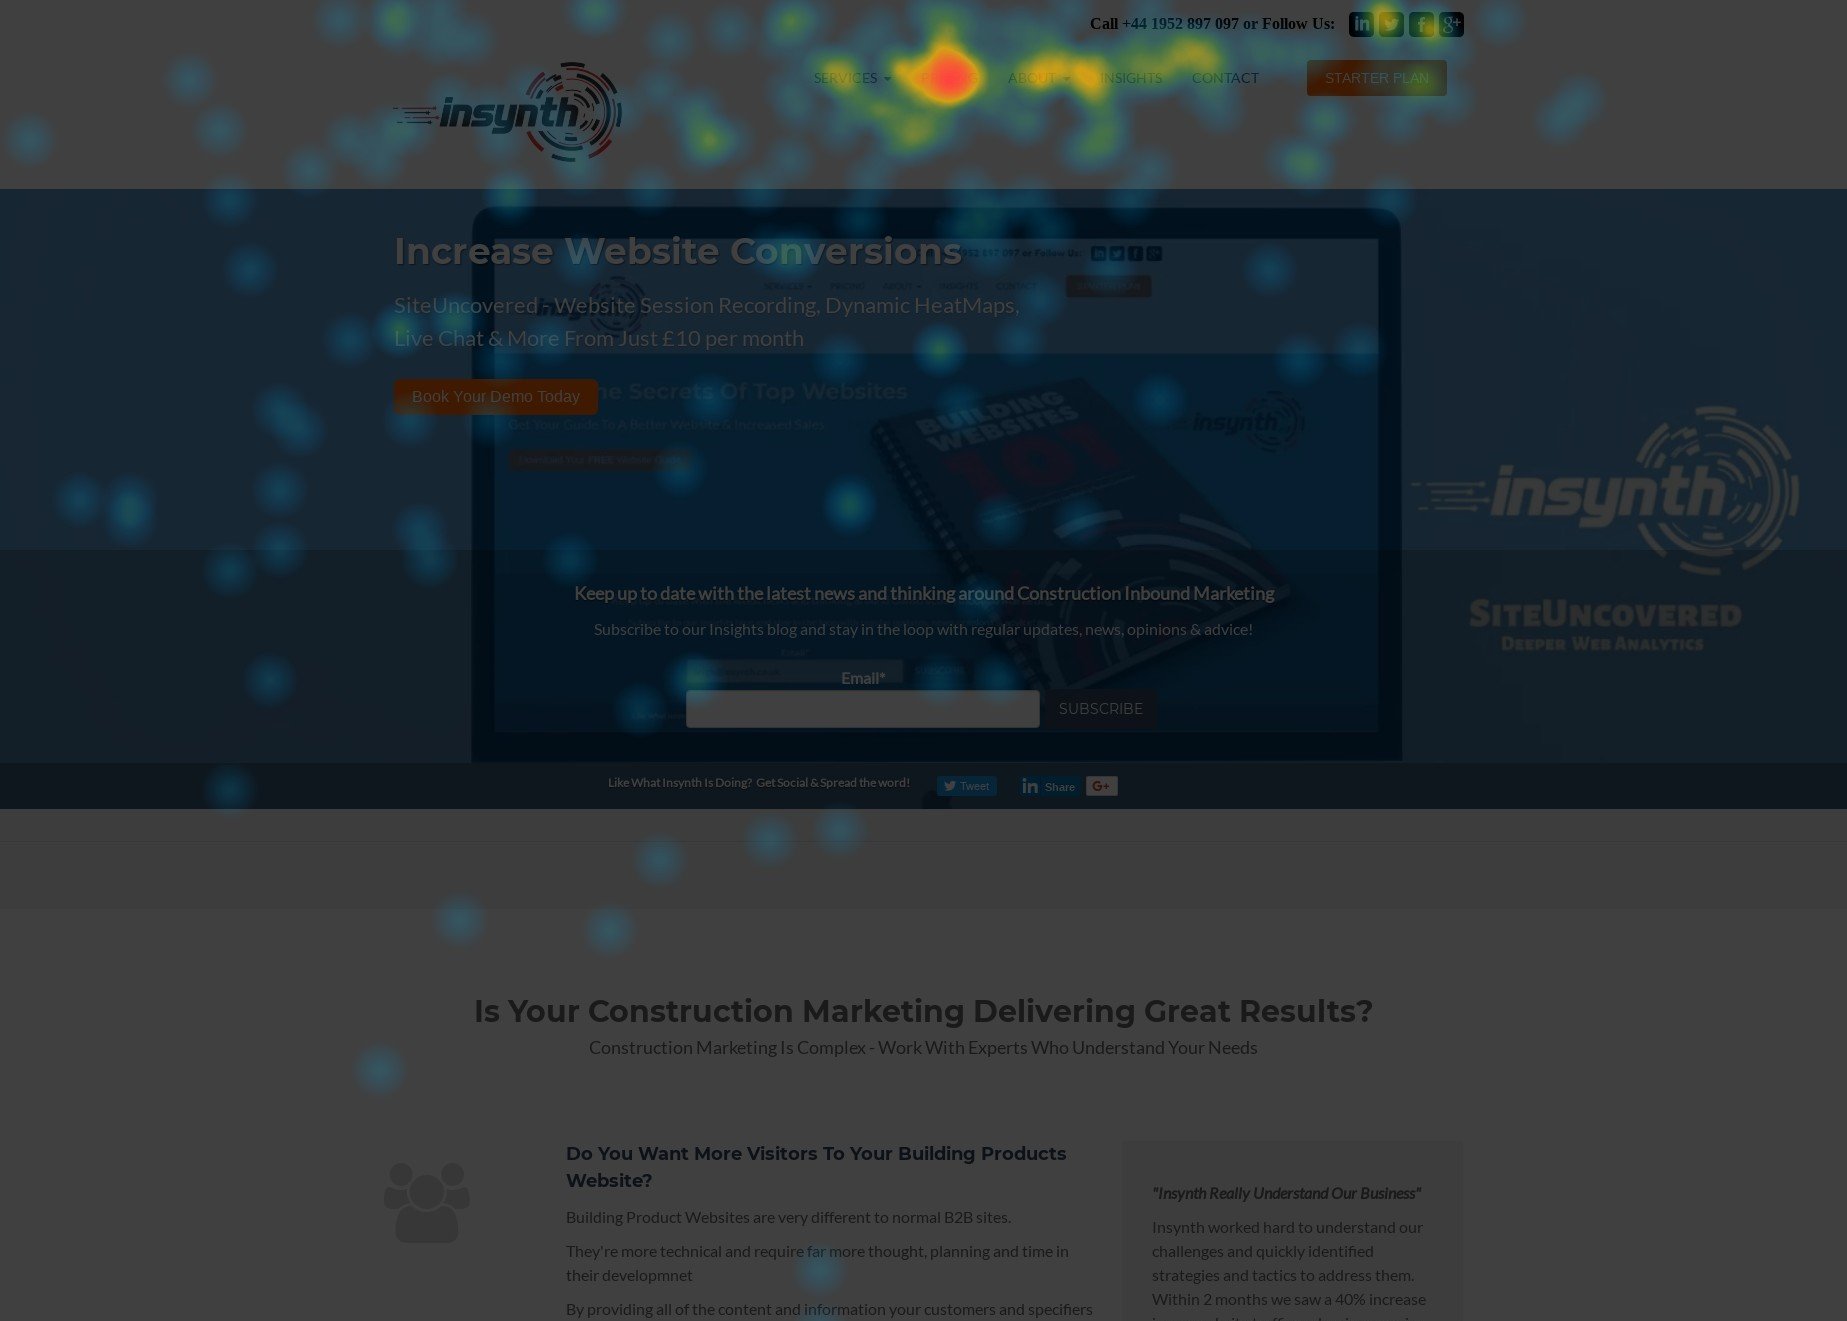
If you’ve identified red flags, now is the time to act. Start by viewing a heatmap of the problem area.
Example: your rainscreen cladding page has a low conversion rate, after doing some further digging you’ve identified that it’s even lower on mobile devices.
Solution: everything looks fine, however after viewing you’re dynamic heatmaps you’ve noticed there isn’t any activity towards the bottom of your page where your ‘speak to our team’ call to action is used.
Follow Up with Visitor Recordings of Problem Areas
Most of the time dynamic heatmaps will give you enough information to identify the problem. You can validate them with recordings of your visitors’ journey.
See where they’re clicking, how they scroll and how they move from page to page.
Example: people are visiting your commercial washroom product page; Google analytics tells you it has a high exit rate. The next logical step in the journey is to view the individual products on that page but people are leaving instead.
Solution: after viewing your dynamic heatmap for your product page, you’ve noticed there are more clicks on photos of your washroom rather than the text links below them.
Your visitor recording shows when people are clicking on the photo, it isn’t leading to the next page. After changing this, you notice a drop in exit rates.
Conclusion
When you combine Google Analytics with dynamic heatmaps and visitor recordings you’ll be able to get a deeper understanding to why visitors aren’t converting.
Whether that be confusing navigation, irrelevant copy or broken call-to-actions. Making data-driven decisions takes the guesswork out of converting architects, specifiers and contractors into potential customers.
If you’ve highlighted red flags in your analytic data, ignoring them can have serious consequences. If these issues are enough to turn potential customers away, then it’s losing you money.
|
Read More |
About Insynth
As the only HubSpot certified agency to major on construction marketing, we bring together construction marketing strategy, digital strategy, website design, SEO, content marketing, email marketing, sales automation, marketing automation and HubSpot CRM implementation to produce successful campaigns and great results for our clients.