Optimise Your Time
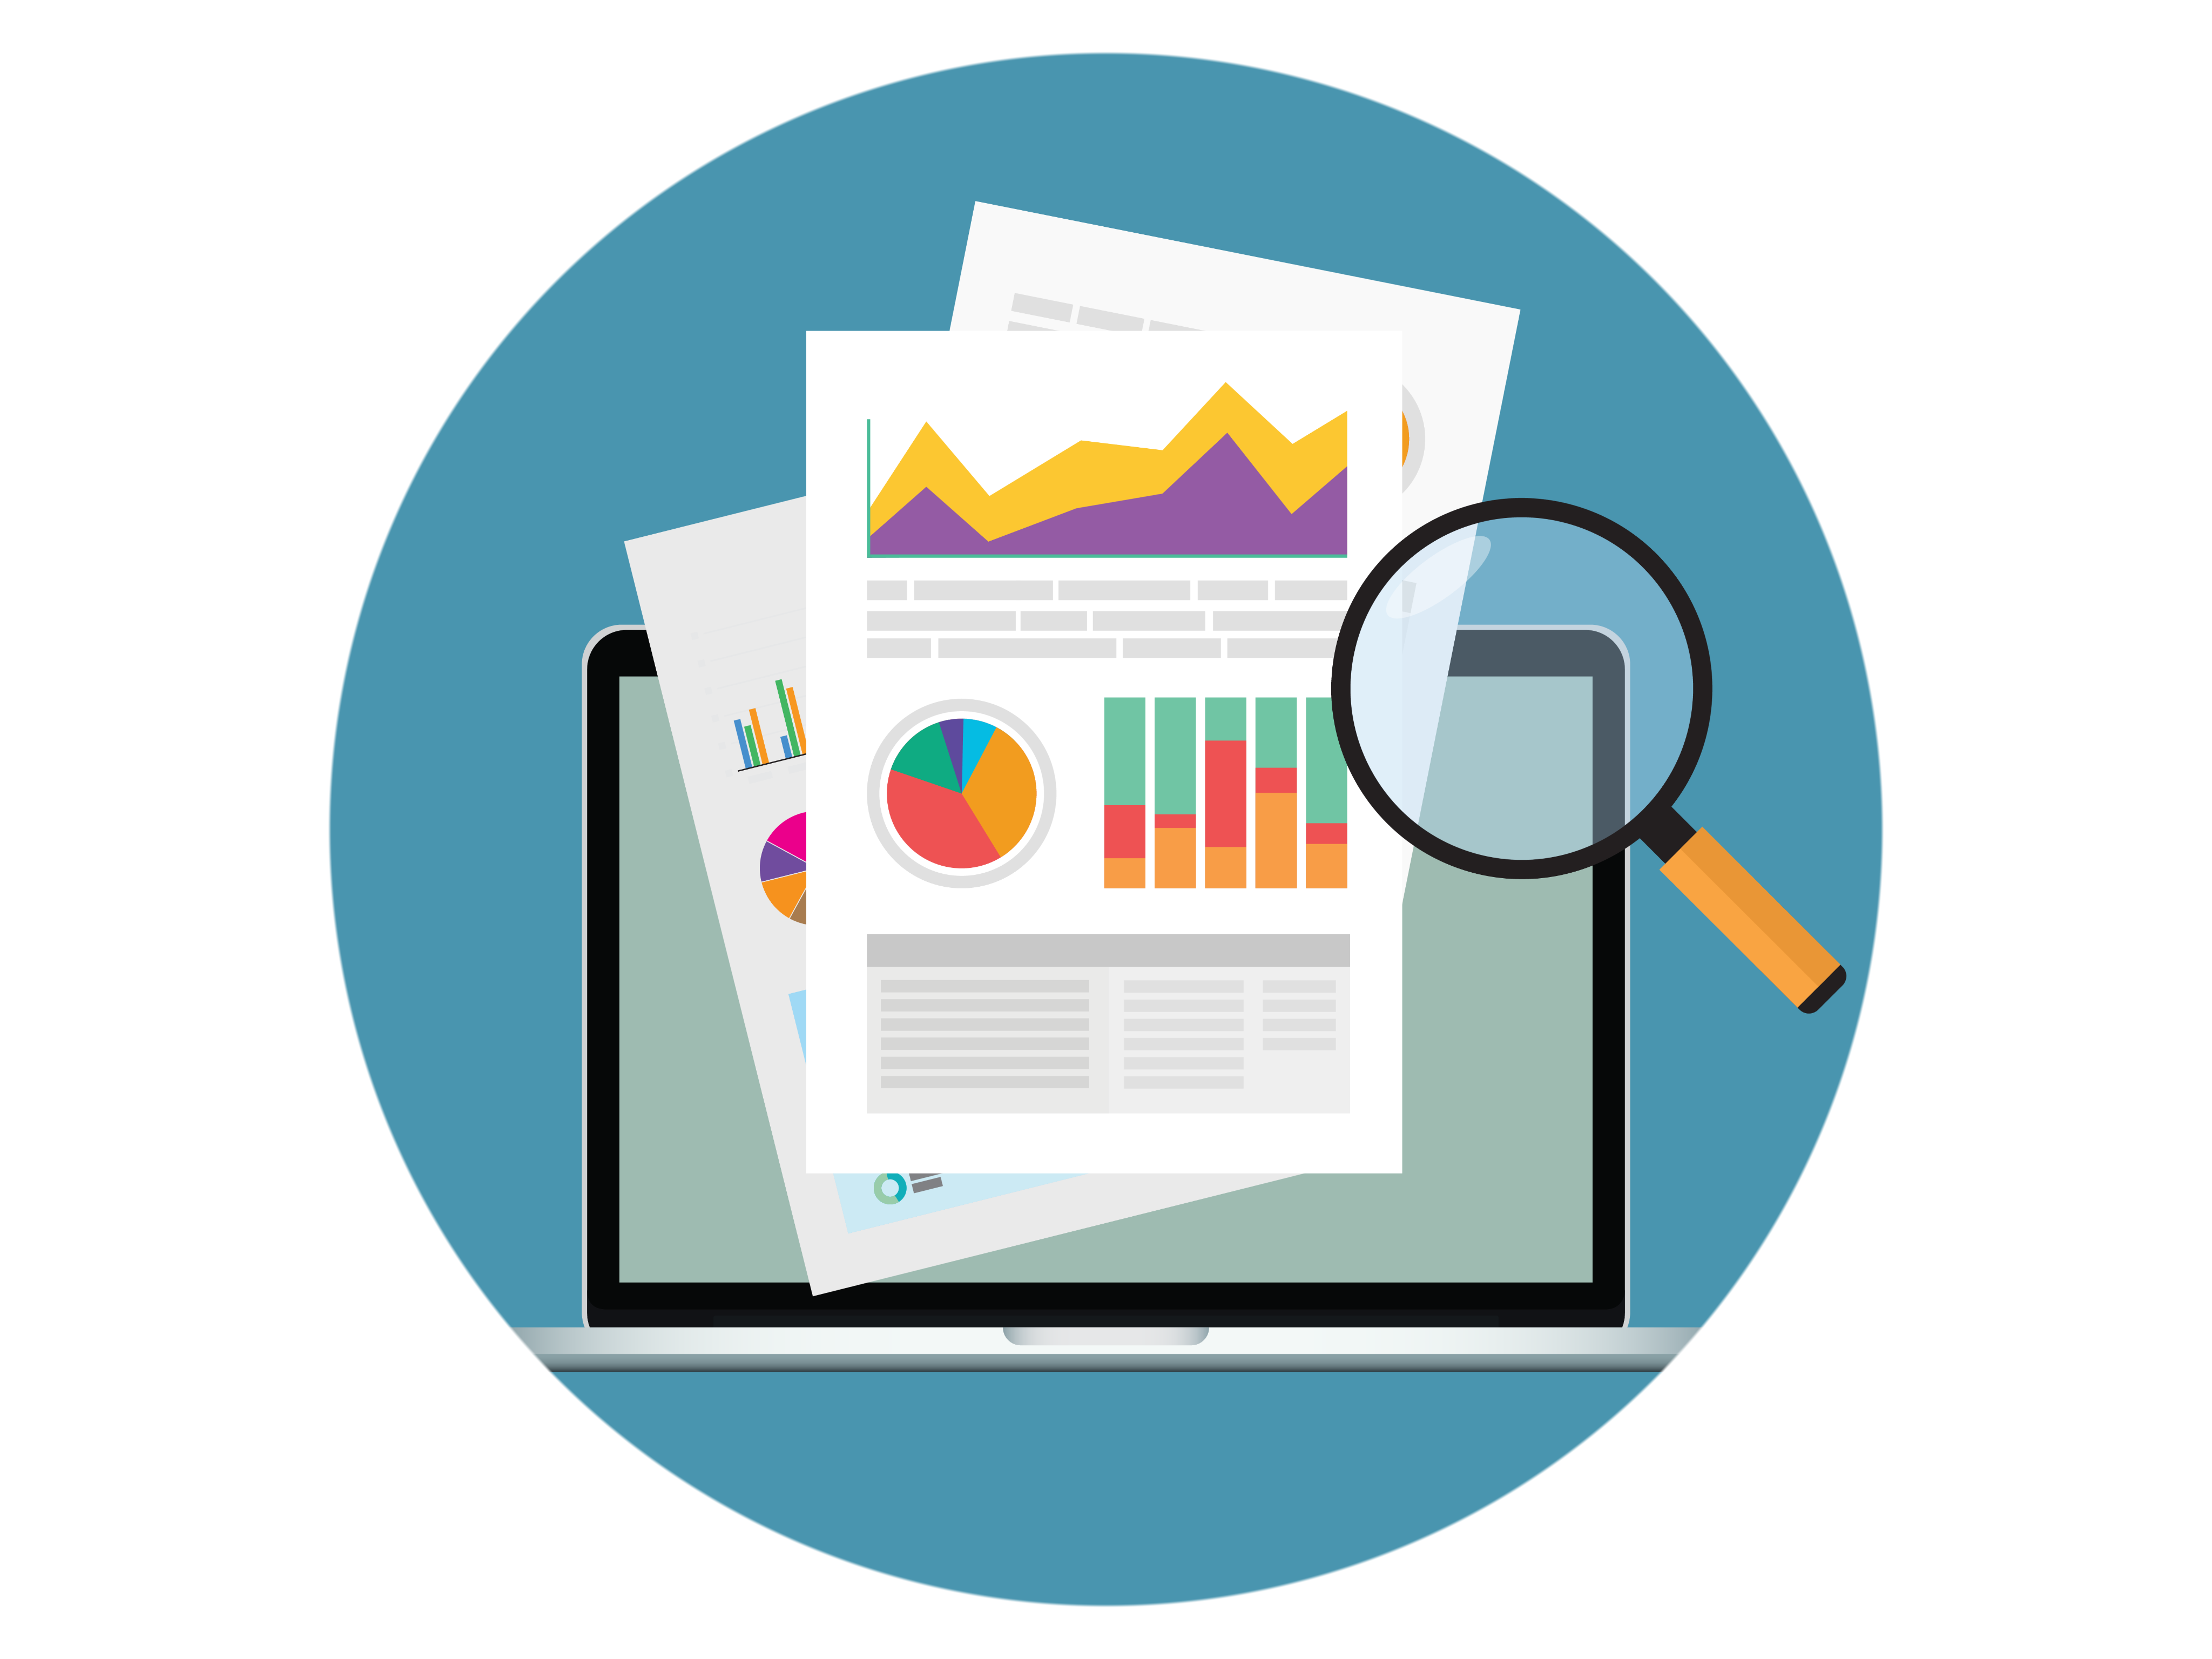
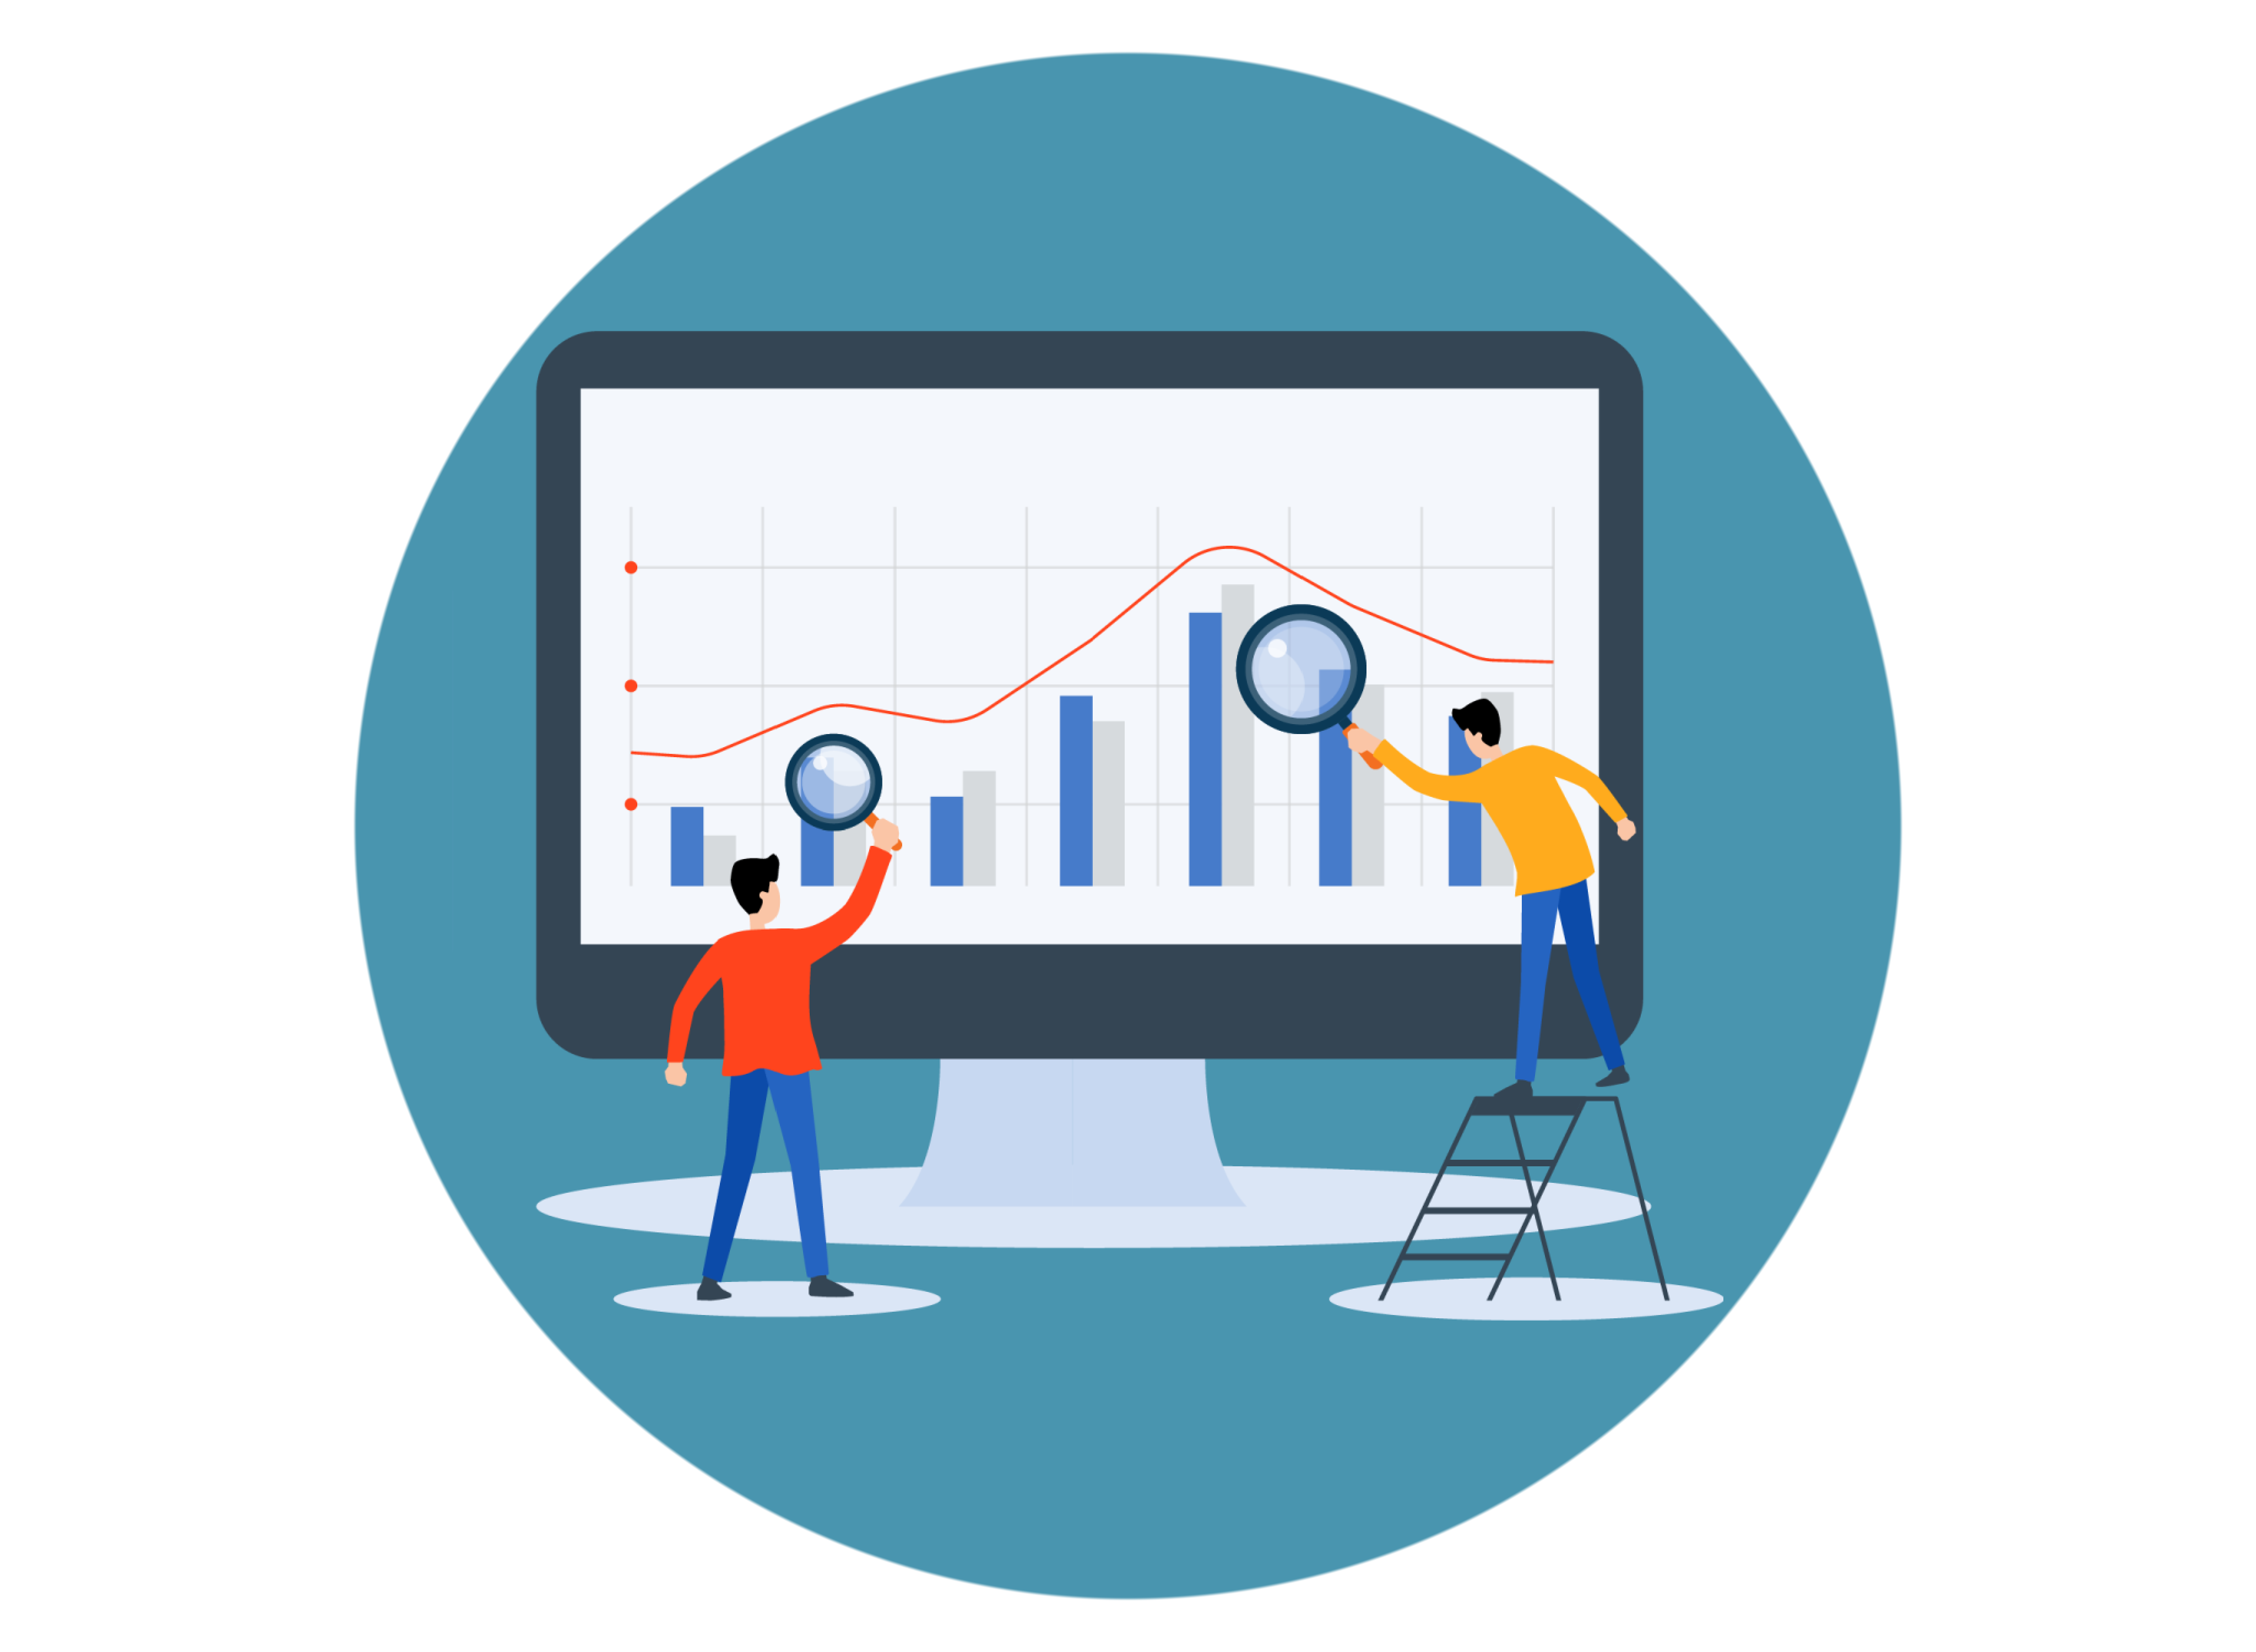
Reporting and Analytics work best when it's incorporated within a central CRM system as it gives you the opportunity to look at your entire process and identify actionable insights from each stage of your customer's journey to maximise your ROI.
With the number of reports you need to produce on a regular basis, it can be difficult to completely optimise your time and get the most out of your data.
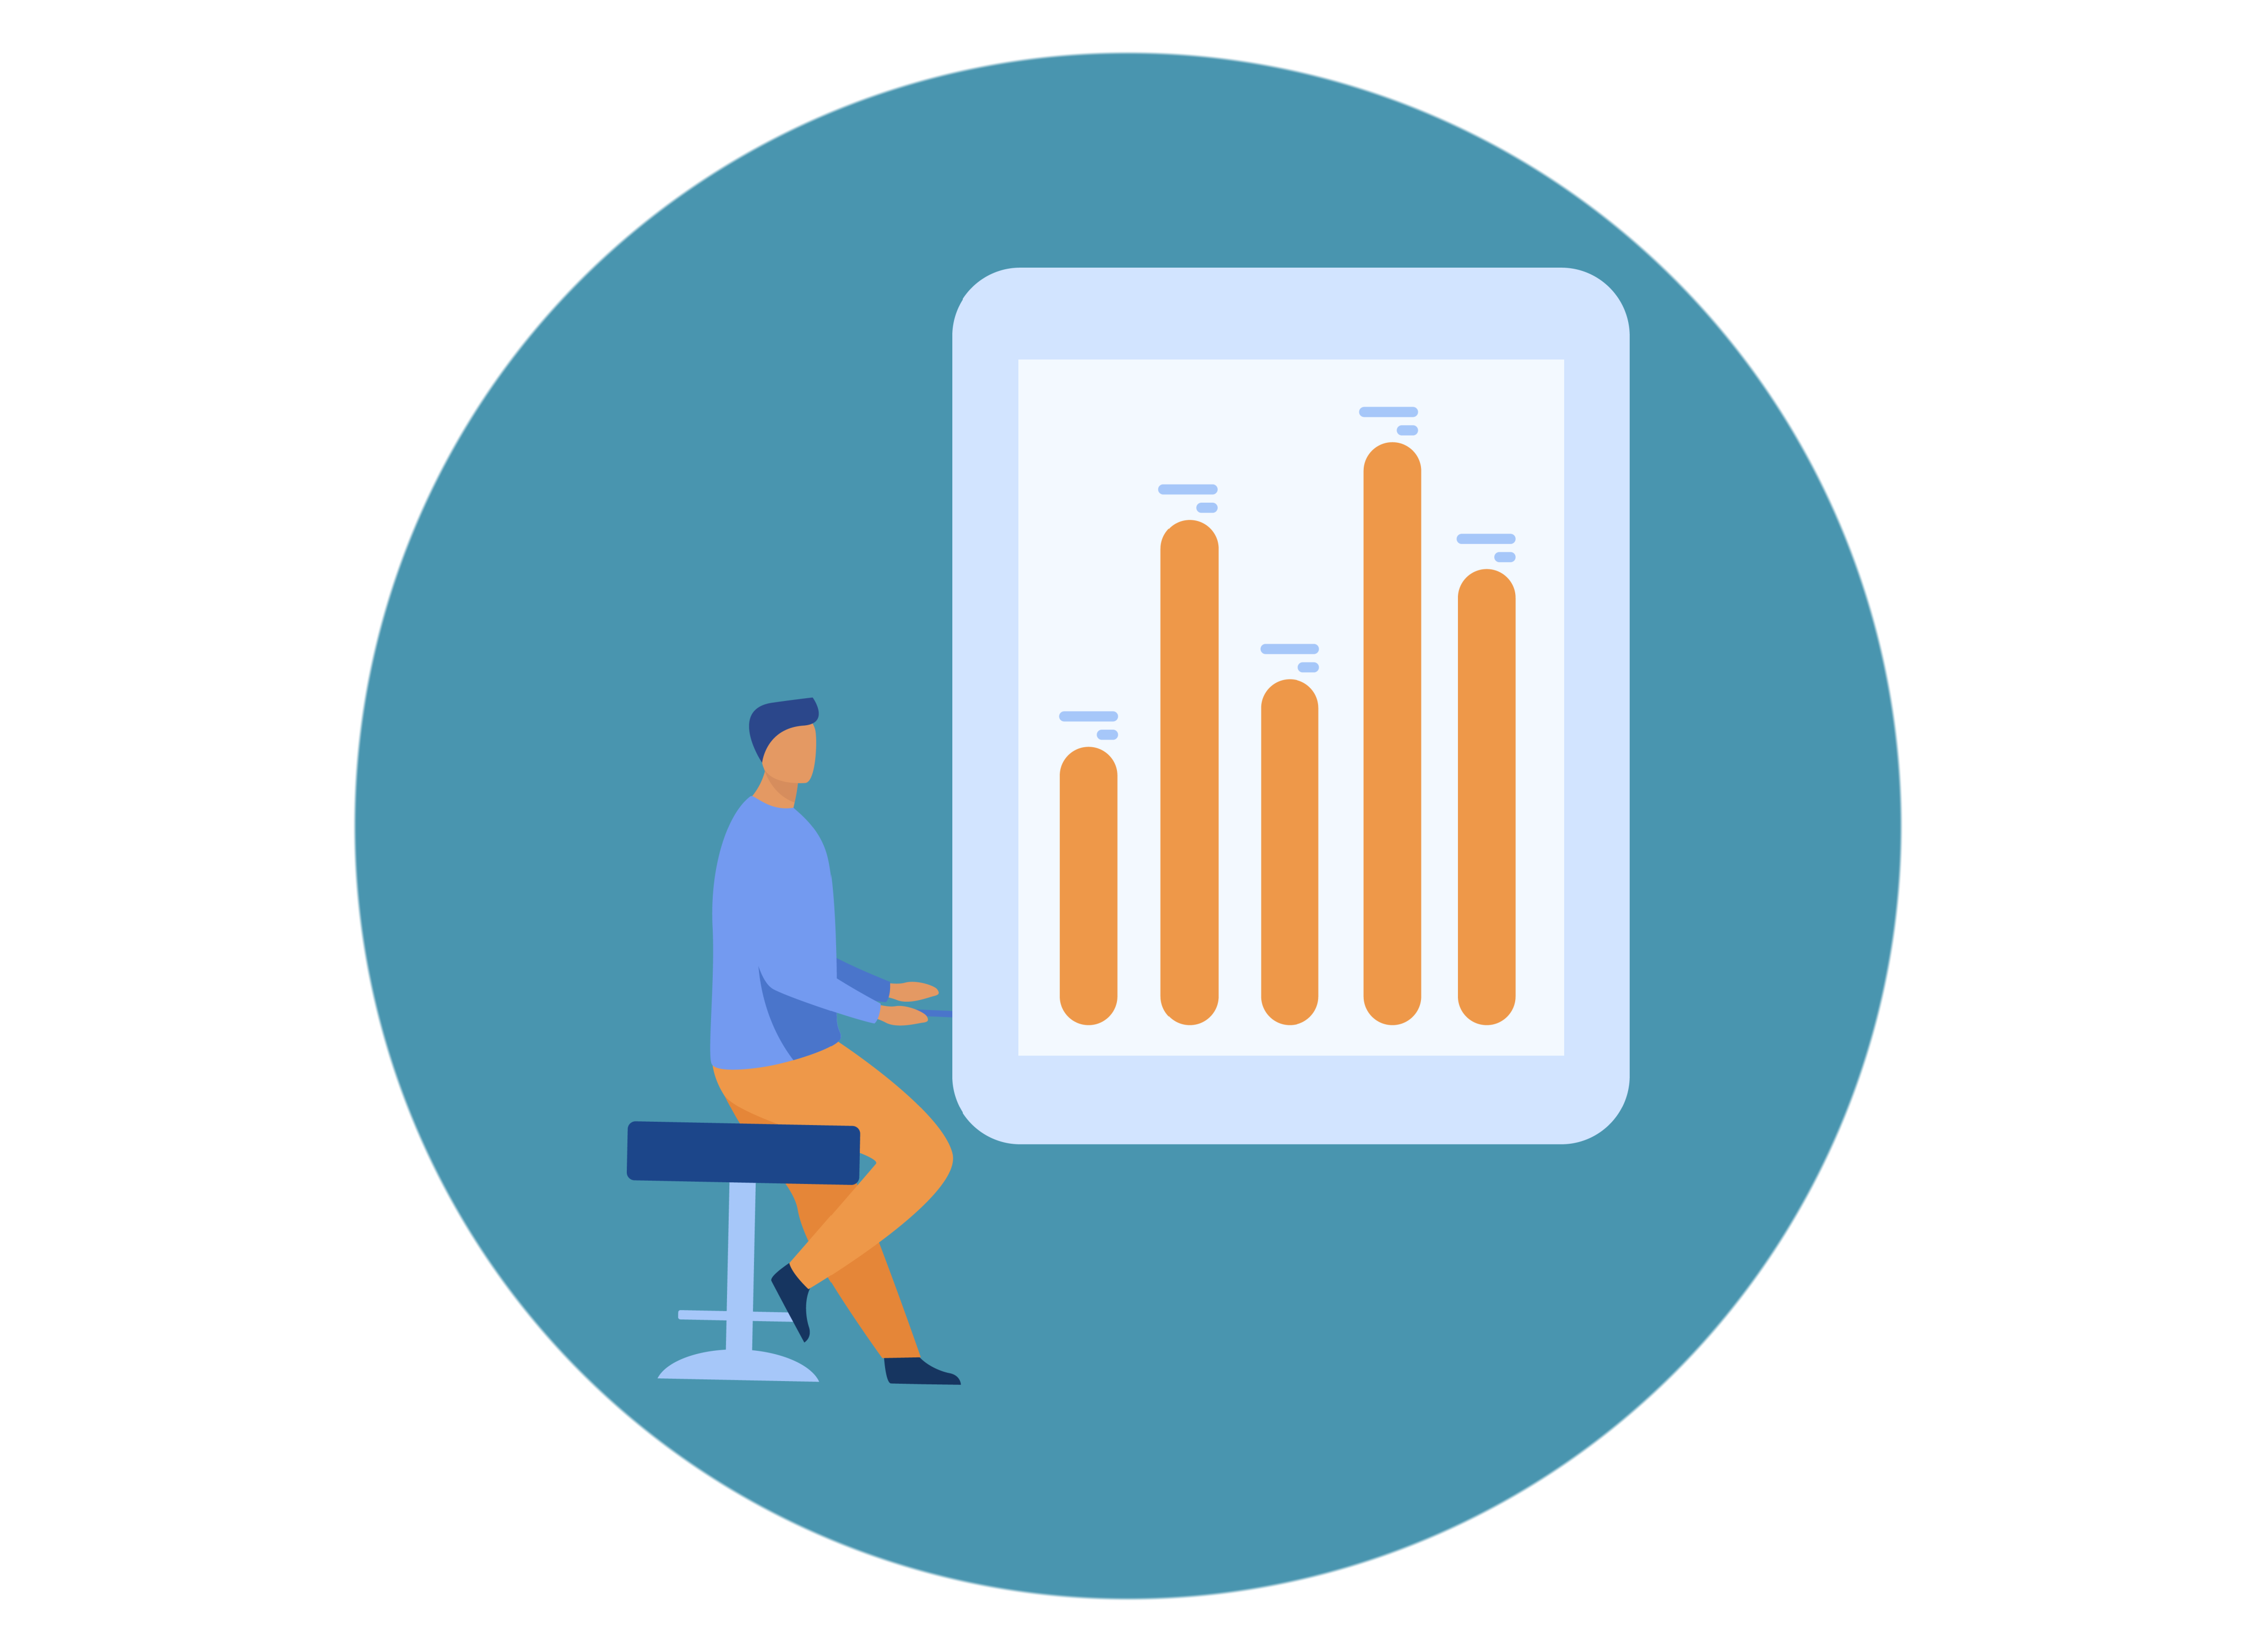
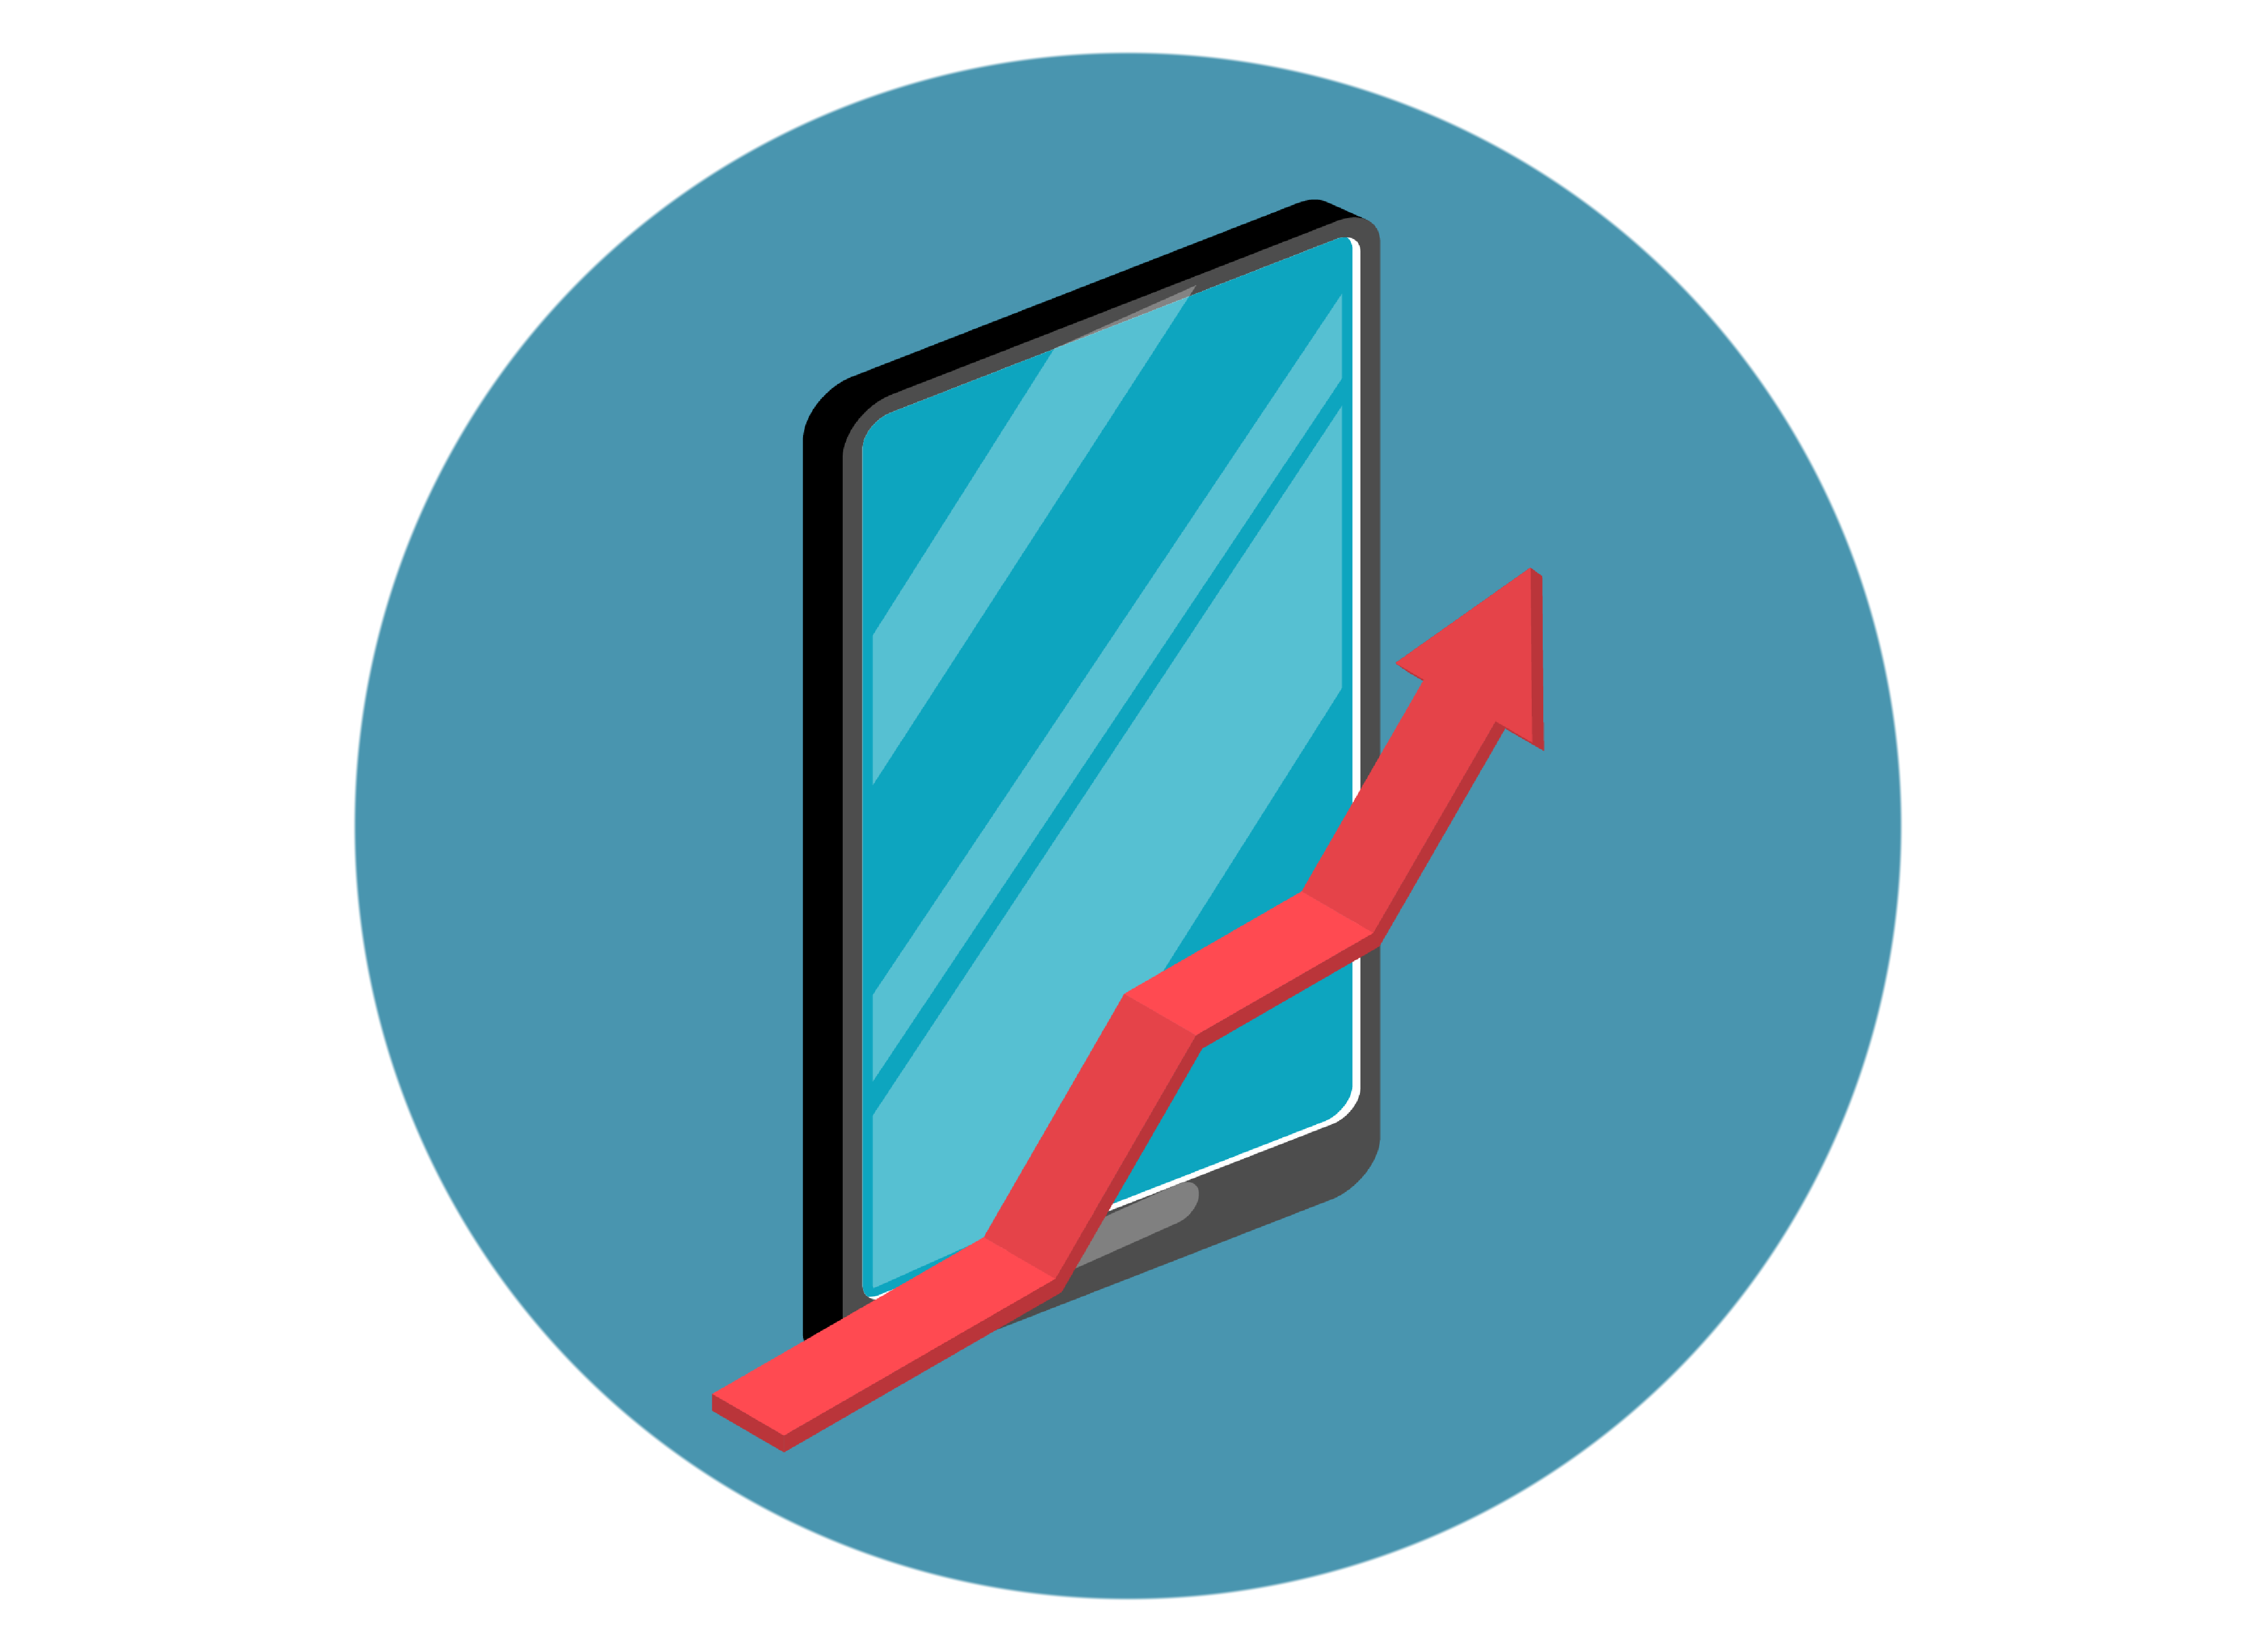
This is why we construct your reporting engine for you, so instead of having to produce time-consuming reports, you receive detailed live updates simultaneously on well-scoped out data dashboards, no matter where you are or which device you're operating. Enabling you to grow better.


.png)
.png "Reporting and Analytics - Cycle (1)")

.png)
.png?width=250&name=Blank%202000%20x%202000%20(3).png)
.png?width=250&name=Blank%202000%20x%202000%20(4).png)